Introduction: The Quiet Revolution in Business Energy
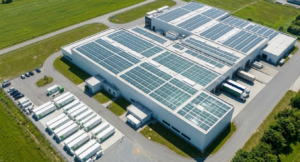
Walk through a mid-sized auto parts factory in Bavaria today, and you might not notice anything unusual at first glance. The assembly lines hum as they always have, the lights are on, the machines are running. But look a little closer, and you will spot a row of steel cabinets along the far wall — sleek, quietly ventilated, each about the size of a large refrigerator. Those cabinets are not spare parts storage. They are the factory’s secret weapon against a European electricity market that has grown increasingly volatile since 2022.
The factory manager, Thomas Bauer, will tell you that installing a 600 kWh lithium iron phosphate (LFP) battery system two years ago was one of the smartest decisions he ever made. “We were paying peak-demand charges that were honestly embarrassing,” he said during an industry roundtable in Munich. “Within the first year, we cut our electricity bill by nearly 18%. The system paid for a significant chunk of itself before we even started thinking about grid services.”
Thomas’s experience is not unique. Across Europe, North America, and Asia-Pacific, commercial and industrial (C&I) organizations — manufacturers, warehouses, hospitals, data centers, retail chains, office campuses — are discovering that energy storage is no longer a niche technology reserved for utilities or off-grid enthusiasts. It is a mainstream financial and operational tool, and the numbers back that up.
This guide covers four core areas that every decision-maker should understand before investing in C&I energy storage:
- The scale of the global market and what is actually driving its explosive growth (2025–2035)
- Why Europe has become the world’s fastest-growing C&I storage market, with 93% year-over-year growth in H1 2025
- What a complete C&I energy storage system looks like — and why the four core components matter more than the battery brand
- The dominance of LFP battery chemistry, and why 69% of all deployments now use this technology

Chapter 1: From $7.1 Billion to $31.8 Billion — Understanding the C&I Storage Market
The Numbers Behind the Growth Story
Numbers can feel abstract when you’re trying to make a real-world investment decision, so let’s put the C&I energy storage market in context. As of 2025, the global commercial and industrial energy storage market is valued at approximately $7.11 billion. By 2035, that figure is projected to reach $31.82 billion — a compound annual growth rate (CAGR) of roughly 16.17%.
To put that growth rate in perspective: that is faster than the global electric vehicle market, faster than solar panel adoption in its early boom years, and roughly on par with the growth of cloud computing in its first decade. What’s driving it?
Three structural forces are converging simultaneously. First, electricity prices across major markets have become significantly more volatile, with industrial customers facing peak-demand charges that can represent 30–70% of their total electricity bills. Second, corporate sustainability commitments — from Scope 2 emissions targets to net-zero pledges — are creating real financial incentives to maximize on-site renewable consumption. Third, grid reliability concerns, amplified by the energy crises of 2021–2023 in Europe and increasingly frequent extreme weather events in North America, have pushed backup power from “nice to have” to “essential infrastructure.”
Three Regions, Three Growth Stories
The $7.1 billion market is not evenly distributed. North America, Asia-Pacific, and Europe each account for the lion’s share, but they are getting there by very different paths. The table below breaks down the current landscape.
| Region | 2025 Market Share | Core Policy Driver | Key Markets | Growth Outlook |
| North America | 32% | IRA 30% Tax Credit (Investment Tax Credit) | USA, Canada | ★★★★☆ Strong |
| Asia-Pacific | 30% | Renewable subsidies, export-oriented manufacturing | China, Japan, Australia | ★★★★★ Very Strong |
| Europe | 28% | REPowerEU, Dynamic Tariffs, National Subsidy Schemes | Germany, France, UK, Italy | ★★★★☆ Strong |
| Middle East & Africa | 6% | Energy independence & desalination needs | UAE, Saudi Arabia, South Africa | ★★★☆☆ Emerging |
| Latin America | 4% | Grid expansion, renewables integration | Brazil, Chile, Mexico | ★★★☆☆ Emerging |
Table 1: Global C&I Energy Storage Market by Region — 2025 Snapshot
North America’s 32% share is anchored by the U.S. Inflation Reduction Act (IRA), which provides a 30% investment tax credit for standalone storage systems — a provision that did not exist before 2023. That single policy change fundamentally altered the economics of C&I storage deployments across the country, bringing payback periods down by 1–2 years on typical projects.
Asia-Pacific’s growth story is more complex. China drives the bulk of the volume through a combination of domestic deployment and the world’s most aggressive battery manufacturing scale-up. Meanwhile, Australia has emerged as a surprisingly sophisticated market, with retailers and manufacturers using behind-the-meter storage to navigate some of the world’s most volatile wholesale electricity prices.

Case Study: A German Manufacturer Turns Energy Volatility into Competitive Advantage
📍 Case Study: Mittelstand Manufacturing Company, Bavaria, Germany — 2025 Deployment
The case described in this article’s opening paragraphs reflects a real pattern playing out across German industry. A medium-sized auto components manufacturer was facing peak electricity prices that had more than tripled since 2021, driven by the aftershocks of the European energy crisis. Their peak-demand tariff window — typically 7am to 9pm on weekdays — was eating into margins on every product they shipped.
The solution was a 500 kWh LFP battery system, installed alongside an upgraded energy management system (EMS) that could read real-time EPEX Spot pricing data and automatically adjust charging and discharging schedules. The system charges during off-peak overnight hours (typically priced at €0.08–0.12/kWh) and discharges during the expensive morning and late-afternoon peaks (€0.28–0.45/kWh in 2025).
The financial results after 12 months:
- Annual electricity cost reduction: €82,000
- Demand charge reduction: ~31% of previous peak-demand fees
- System internal rate of return (IRR): 14.3%
- Estimated full payback period: 5.1 years (before any grid service revenues)
The factory is now also registered with a virtual power plant (VPP) aggregator, which occasionally dispatches the storage asset for grid frequency regulation. That adds a modest but growing additional revenue stream that the finance team had not originally modeled.
Europe’s 93% Surge — What’s Actually Happening and Why It Matters
The Three Catalysts Behind Europe’s Storage Boom
When the final numbers came in for H1 2025, even analysts who had been bullish on European C&I storage had to do a double-take. Shipments hit 4 GWh in just six months — a 93% increase year-over-year. That kind of growth does not happen by accident, and it does not happen because of one factor alone. It takes a convergence.
The first catalyst was REPowerEU, the European Commission’s plan to reduce dependence on Russian fossil fuels, which funneled billions of euros into renewable energy infrastructure and, critically, into the storage systems needed to make intermittent solar and wind actually useful for industrial customers. The second was the widespread rollout of dynamic electricity pricing — real-time or half-hourly prices tied to wholesale market conditions. When industrial customers can see their electricity cost changing by a factor of four or five within a single day, the financial case for storage becomes extraordinarily compelling.
The third catalyst is perhaps the most underappreciated: the maturation of battery management software. Five years ago, deploying a C&I storage system meant hiring specialized engineers to configure complex charge/discharge schedules. Today, AI-enabled EMS platforms can automate most of that optimization, making storage accessible to a much wider range of businesses.
2.2 Country-by-Country: Where the Returns Are Strongest
Not all European markets offer the same returns. Policy design, grid structure, and local electricity pricing all influence the economics of C&I storage significantly. The table below compares five of the most active European markets.
| Country | Key Policy Instrument | Dynamic Pricing Mechanism | Typical Project IRR | Market Maturity |
| Germany | KfW low-interest loans + accelerated depreciation | EPEX Spot real-time pricing | 14–16.88% | High — mature & competitive |
| United Kingdom | CSEP support scheme + Capacity Market | Octopus Agile / half-hourly tariffs | 12–15% | High — innovator market |
| France | Capacity market premium + EDF tariff reform | ARENH mechanism transition | 11–14% | Medium-High — growing rapidly |
| Italy | Superbonus derivative schemes + CIP6 transition | GME intraday market | 10–13% | Medium — accelerating |
| Spain | PERTE Chip & IDAE financing programs | OMIE day-ahead market | 9–12% | Medium — policy-driven growth |
Table 2: European C&I Energy Storage Investment Environment by Country — 2025
Germany stands out for a reason that goes beyond just generous financing. The combination of the EPEX Spot real-time market, large industrial loads, and a well-developed EMS software ecosystem means that German storage projects can genuinely achieve IRRs approaching 17% under favorable conditions. That is not a cherry-picked number — it reflects projects with above-average solar self-consumption rates combined with aggressive demand charge management.
The UK market tells a slightly different story. The country’s Agile Tariff structure, pioneered by Octopus Energy, means that retail electricity customers — including smaller commercial and industrial users — can access genuinely dynamic pricing without needing to participate directly in wholesale markets. This has democratized storage economics in a way that is not yet replicated elsewhere in Europe.

2.3 Case Study: UK Retail Chain and the Agile Tariff Opportunity
📍 Case Study: UK Multi-Site Retail Chain — 300 Stores, 2024–2025 Rollout
One of the more ambitious C&I storage rollouts in Europe has been underway at a major UK grocery and retail chain, which has been systematically deploying behind-the-meter battery systems across its store network. The initiative began as a pilot in 2022 with 12 stores and has since expanded to over 300 locations.
Each store installation typically involves a 75–150 kWh LFP system, connected to the building management system and programmed to respond to Octopus Agile’s half-hourly pricing signals. During negative pricing periods — which occur with surprising frequency in the UK’s wind-heavy grid — the system charges at essentially zero or even negative cost. During evening peaks, it discharges, avoiding the expensive tariff bands.
Per-store annual savings range from £18,000 to £25,000, depending on store size and local grid conditions. Across the 300-store estate, the cumulative annual saving is estimated at £6–7 million. The chain has publicly committed to reaching 500 sites by the end of 2026 and is exploring whether the aggregated fleet can participate in the UK’s Balancing Mechanism as a virtual power plant.
2.4 The Chinese Supplier Angle
It would be incomplete to discuss European C&I storage growth without addressing supply chain dynamics. European battery manufacturing capacity is nowhere near sufficient to meet the current demand surge. Chinese manufacturers — most notably CATL, BYD, and a cohort of fast-growing tier-2 suppliers — are filling that gap aggressively.
For European buyers, this creates a pragmatic calculation. Chinese LFP systems are typically 20–35% cheaper on a per-kWh basis than European-assembled alternatives, with no meaningful difference in core performance metrics. The counterargument — supply chain security, import duties, and the EU’s developing Carbon Border Adjustment Mechanism — is real but has not yet materially slowed procurement decisions at the project level.
Chapter 3: What Is Actually Inside a C&I Energy Storage System?
3.1 Why “Battery” Is the Wrong Way to Think About It
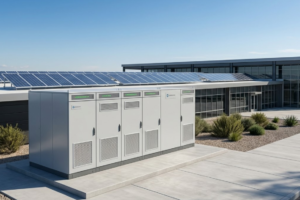
Here is something that surprises many people when they first explore C&I energy storage: the battery is almost the least interesting part of the system. That is not meant to dismiss the chemistry or the engineering that goes into the cells — it is a recognition that a battery pack sitting in a warehouse does nothing useful on its own. What transforms a collection of lithium cells into a productive business asset is the ecosystem of hardware and software built around it.
A properly engineered C&I energy storage system consists of four distinct functional layers, each doing a job that the others cannot do:
| Module | Full Name | Primary Function | Key Technical Specs | Selection Criteria |
| Battery Pack | Battery Pack / Cell Stack | Store and release electrical energy on demand | Capacity (kWh), Depth of Discharge (DoD), Cycle Life | Chemistry (LFP vs NMC), temperature tolerance, safety certifications (CE, IEC 62619, UN38.3) |
| BMS | Battery Management System | Monitor, protect, and balance individual cells in real time | SOC accuracy ±1%, response time <10ms, cell-level monitoring | Active vs passive balancing strategy, fault diagnostics depth, communication protocols (CAN, Modbus) |
| PCS | Power Conversion System | Bidirectional AC/DC conversion — charges from grid, discharges to loads | Conversion efficiency ≥96%, response time <20ms, grid code compliance | Grid interconnection standards (IEEE 1547, VDE 4105), harmonic suppression, islanding capability |
| EMS | Energy Management System | Orchestrate charging/discharging strategy, optimize economics, provide data analytics | AI algorithm capability, API integration, real-time pricing data feeds | Cloud platform compatibility, live tariff data integration, VPP aggregation support, remote monitoring |
Table 3: C&I Energy Storage System — Four Core Modules Compared
The way these four modules interact is worth understanding in detail, because it directly affects how you evaluate competing systems. The Battery Pack and BMS form the physical foundation — the BMS is essentially the nervous system of the battery, monitoring hundreds or thousands of individual cells and preventing dangerous conditions like overcharge, overdischarge, and thermal runaway. Without a well-engineered BMS, even the best battery chemistry will degrade prematurely.
The PCS sits between the battery and the grid or building loads. Every time energy flows in or out of the battery, it passes through the PCS, which means PCS efficiency directly affects the round-trip economics of the system. A PCS with 94% efficiency means you lose 6% of every kWh that cycles through the system. A system running 2,000 cycles per year at 500 kWh capacity loses roughly 60 MWh annually to PCS inefficiency alone. At €0.15/kWh, that is €9,000 per year. Specification details matter.

3.2 The EMS: Where the Real Money Is Made
If you ask an energy storage professional which component has seen the most dramatic improvement in the past three years, almost all of them will say the EMS. And if you look at where the competitive differentiation is happening among leading suppliers right now, EMS capability is typically at the center of it.
A modern AI-enabled EMS does not just follow a programmed schedule — it learns. It ingests historical load data, weather forecasts, real-time electricity prices, solar generation predictions, and building occupancy patterns, and builds a continuously updated optimization model. The difference in annual returns between a basic rule-based EMS and an AI-optimized one can be 15–25%, according to operational data from deployed systems in Germany and the UK.
The EMS is also the gateway to value streams beyond bill reduction. Virtual power plant participation, demand response programs, frequency regulation services — all of these require an EMS capable of receiving dispatch signals and executing them with millisecond-level precision. As these ancillary revenue streams mature, the EMS becomes increasingly central to the business case for storage.
3.3 Case Study: A Data Center’s 2 MWh System
📍 Case Study: European Colocation Data Center — 2 MWh System Deployment, 2024
A mid-tier colocation data center in the Netherlands faced a dual challenge: its legacy UPS infrastructure was aging out, and its demand charges were escalating as the facility expanded capacity to serve AI workloads. Rather than replace the UPS with a like-for-like system, the operations team made a decision to integrate a 2 MWh battery storage system that could serve as UPS backup, peak-demand management tool, and grid services asset simultaneously.
The system configuration: ten modular 200 kWh battery cabinets — a design that allows capacity to be expanded in 200 kWh increments without any downtime. The PCS runs at 90.8% system efficiency, and the EMS is integrated with both the facility management system and the Dutch grid operator’s real-time pricing API.
Operational results after one year:
- System availability: 99.2% (better than the legacy UPS it partially replaced)
- Demand charge reduction: 28% compared to pre-installation baseline
- Grid frequency regulation revenue: approximately €45,000 in Year 1
- Full AC-to-AC round-trip efficiency: 88.4%
The facility manager noted that the modular design was a key factor in the decision. “We can add another 200 kWh module in a weekend. With our old UPS infrastructure, any capacity increase meant weeks of planning and significant downtime risk.”
Chapter 4: LFP Battery Chemistry — Why It Won the C&I Market
4.1 The Chemistry Decision That Changed Everything
For most of the 2010s, the dominant battery chemistry in commercial energy storage was nickel manganese cobalt (NMC). It had higher energy density, which made it attractive for applications where space was at a premium. But C&I energy storage is not usually space-constrained in the way that an electric vehicle is. What C&I customers actually care about is longevity, safety, and total cost of ownership over a 10–15 year asset life.
On all three of those dimensions, lithium iron phosphate — LFP, or LiFePO4 — simply wins. And the market has recognized it: as of 2025, LFP accounts for 61% of all lithium-ion C&I storage deployments globally, with NMC holding most of the remainder.
The performance gap has widened as LFP manufacturing has scaled. In 2020, a high-quality LFP cell might be rated for 3,500 cycles at 80% depth of discharge. By 2025, leading manufacturers are routinely certifying cells at 6,500 cycles or more under the same conditions — enough for roughly 18 years of once-daily cycling. NMC cells, running under the same conditions, typically deliver 3,000–4,000 cycles before reaching end-of-life thresholds.
Safety is the other dimension where LFP’s advantage is decisive. The iron-phosphate bond is thermally very stable: LFP cells do not enter thermal runaway until temperatures exceed approximately 270°C. NMC cells, by contrast, can begin exothermic reactions at temperatures as low as 170–180°C. In a commercial or industrial environment — where fire safety codes are strict and insurance underwriters are paying close attention — that difference is not academic.
4.2 The Certification Landscape: What CE, IEC 62619, and UN38.3 Actually Mean
For procurement teams buying C&I storage systems — especially those procuring for European deployment — navigating battery certifications can feel overwhelming. Here is a practical breakdown of the three certifications that matter most, and what they actually test:
CE marking is the entry ticket for any product sold in the European Union. For energy storage, it covers the Low Voltage Directive, the Electromagnetic Compatibility Directive, and increasingly, requirements under the EU Battery Regulation that came fully into force in 2024. CE marking tells you the product has been assessed against European safety and performance standards — but it does not, on its own, tell you much about battery-specific behavior under stress.
IEC 62619 is the international standard specifically for secondary lithium cells and batteries used in industrial applications. It covers abuse testing — overcharge, overdischarge, short circuit, crush, thermal stress — that directly replicates the kinds of edge cases that can cause battery failures in real deployments. A system with IEC 62619 certification has been tested against scenarios that would destroy an inadequately designed battery pack.
UN38.3 is a transport safety certification, but its relevance extends beyond shipping. It tests batteries under extreme altitude, temperature cycling, vibration, shock, external short circuit, impact, overcharge, and forced discharge — a comprehensive stress test battery that, when passed, provides meaningful evidence of fundamental safety robustness.
For the North American market, UL 9540 (system-level safety for energy storage systems) and UL 9540A (fire testing) are the equivalent benchmarks. A system that holds both IEC 62619 and UL 9540 certifications is the gold standard for cross-market deployment.
4.3 Case Study: Five-Year Performance Tracking on a Solar-Storage Factory
📍 Case Study: Photovoltaic + LFP Storage Integration — Manufacturing Plant, 2019–2024
In 2019, a food processing plant in southern France installed an 800 kW rooftop solar array paired with a 600 kWh LFP battery system. The decision was partly driven by sustainability goals and partly by a desire to hedge against electricity price increases that the company’s energy consultant predicted were coming. (They were right, as it turned out — dramatically so.)
The plant agreed to share operational data for research purposes, and the five-year results tell a compelling story about LFP’s real-world performance in a challenging environment — fluctuating temperatures, aggressive daily cycling, occasional grid outages that pushed the system into islanding mode:
- Cycle count over 5 years: approximately 1,825 full cycles (once daily average)
- Measured battery capacity retention at Year 5: 88.4% of rated capacity (manufacturer warranted 80%)
- Actual capacity degradation: under 12% — well below the 20% worst-case projection
- Cumulative electricity cost savings over 5 years: $340,000
- Actual payback period: 4.8 years — 14 months ahead of the original 6-year projection
The plant’s energy manager credits the outperformance partly to the LFP chemistry’s inherent longevity and partly to the EMS, which had learned over three years of operation to avoid the charging patterns that are hardest on cell longevity — specifically, frequent charges to 100% state of charge, which the system now avoids unless a grid outage is forecast.

Frequently Asked Questions
These are the questions that come up most often when businesses are evaluating their first — or fifth — C&I energy storage project.
❓ FAQ 1: What is a realistic payback period for a C&I energy storage system in 2025?
Payback periods vary significantly based on system size, local electricity pricing, available incentives, and how aggressively the system is managed. As a general benchmark, well-designed projects in mature markets are achieving paybacks in the 3–7 year range. In European markets with dynamic pricing — particularly Germany and the UK — top-performing projects have compressed paybacks to 2.5–4 years. North American projects leveraging the IRA’s 30% investment tax credit are typically seeing 4–6 year paybacks. The critical variable is not usually the hardware cost — it is the quality of the energy management strategy.
❓ FAQ 2: LFP versus NMC — which chemistry should a C&I business choose?
For the vast majority of C&I applications, LFP is the right choice. Its cycle life advantage (6,500+ vs 3,000–4,000 cycles), superior thermal stability, and lower total cost of ownership over a 10–15 year asset life make it the economically dominant option. The only scenario where NMC warrants serious consideration is where floor space is severely constrained and energy density is genuinely at a premium — for example, in a dense urban substation with very limited room for battery cabinets. In all other C&I contexts, LFP’s safety record and longevity make it the sensible default.
❓ FAQ 3: What certifications does a C&I storage system need to be deployed in Europe?
At minimum: CE marking (covering Low Voltage Directive and EMC Directive), IEC 62619 (battery safety under industrial use conditions), and UN38.3 (transport and stress testing). For grid-connected systems in Germany, compliance with VDE 0510-11 and the relevant distribution network operator’s technical connection requirements is also mandatory. Systems intended for participation in grid frequency response markets will additionally need to meet the specific technical requirements of the relevant Transmission System Operator — in Germany, that means Amprion, TransnetBW, TenneT, or 50Hertz depending on location.
❓ FAQ 4: What does an EMS actually do in day-to-day operation, and does it really need AI?
An EMS orchestrates when the battery charges and discharges, based on inputs including real-time electricity prices, demand forecasts, solar generation predictions, and grid stability signals. A basic rule-based EMS follows fixed schedules — charge between midnight and 6am, discharge between 5pm and 9pm, for example. An AI-enabled EMS continuously updates its optimization model based on actual performance data, learning the building’s load patterns and adjusting strategies accordingly. The performance gap between these approaches is real: AI-enabled systems typically deliver 15–25% more value from the same hardware. Whether that justifies the premium depends on system size — for systems above about 200 kWh, AI-enabled EMS is almost always worth the additional cost.
❓ FAQ 5: What does a complete C&I energy storage system cost to install in 2025?
As of early 2025, all-in installed costs (hardware, installation, commissioning, and first-year monitoring) are typically running in the range of $200–$350 per kWh for LFP-based systems in North America and Europe, depending on system size and site conditions. As a rough guide: a 100 kWh commercial system typically runs $25,000–$40,000 all-in; a 500 kWh industrial system runs $110,000–$175,000; and a 1 MWh system is typically $200,000–$300,000. Costs have been declining roughly 8–12% annually in recent years, though supply chain pressures and tariff uncertainties have introduced some volatility in 2025.
Energy Storage Is Now a Core Business Tool, Not a Technology Experiment
When Thomas Bauer installed his battery system in Bavaria, he was not making a bet on future technology — he was solving a present financial problem with a mature, proven solution. That shift in framing captures where C&I energy storage sits in 2025: it has crossed the threshold from innovative experiment to reliable infrastructure.
The four areas covered in this guide tell a coherent story. The market is growing at 16%+ annually because the underlying value proposition — reduce electricity costs, increase resilience, generate additional revenue from grid services — is real and measurable across thousands of deployed projects. Europe’s 93% H1 growth rate reflects a policy environment that has made storage genuinely attractive, not just theoretically compelling.
At the system level, the maturation of all four core components — Battery Pack, BMS, PCS, and EMS — means that today’s C&I storage systems are genuinely reliable assets. The AI-driven EMS in particular represents a step change from the programmed controllers of five years ago. And LFP’s emergence as the dominant chemistry reflects the market’s practical judgment about what actually matters: longevity, safety, and economics over the full asset life.
For businesses considering their first storage investment, the conversation is no longer primarily about whether the technology works. It is about system sizing, tariff structure, certification requirements, and which value streams are most accessible in your specific market. Those are the right questions to be asking — and increasingly, the expertise and tools exist to answer them precisely.